 English
 Español
 日本語
日本語
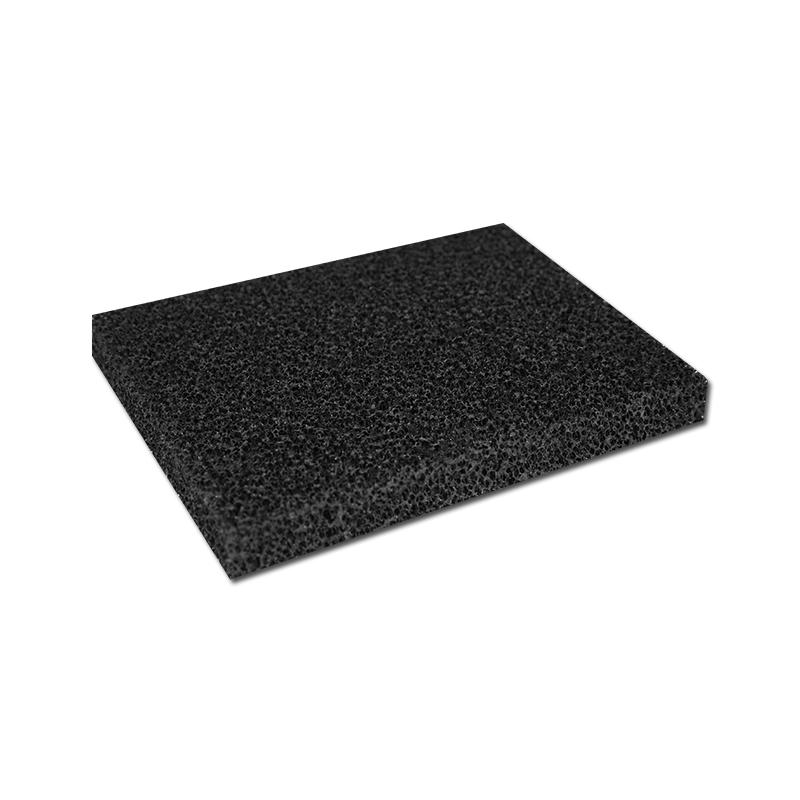
Activated carbon sponge filter media removes impurities and odors through physical adsorption — dissolved molecules stick to the internal pore walls of the carbon by van der Waals attraction and are held there, while the sponge matrix that carries the carbon simultaneously strains out suspended particles. The carbon itself does not dissolve anything, does not chemically neutralize most contaminants, and does not filter water in the conventional sieving sense. It simply offers an enormous amount of surface area — typically 800 to 1,500 square meters per gram, the equivalent of three to six tennis courts folded into a single sugar-cube-sized lump — and organic molecules in water migrate onto that surface because they are more stable adsorbed on carbon than dissolved in water.
Three physical events happen in sequence, and all three must complete for a molecule to be captured:
- The molecule crosses the stagnant water film clinging to the carbon granule (film diffusion).
- It travels down through the branching pore network toward the interior (pore or intraparticle diffusion).
- It settles onto an available site on the pore wall and is held by weak but numerous intermolecular forces (adsorption proper).
Step three is nearly instantaneous. Step two is the rate-limiting bottleneck in almost every real filter, which is why contact time, not carbon quantity, is usually the variable that decides whether a filter works well or poorly. Everything else in this article expands on those three steps and on how the sponge carrier changes their behavior.
What Activated Carbon Sponge Media Actually Is
The term covers two distinct constructions that are frequently confused, and the distinction matters because they adsorb at very different rates.
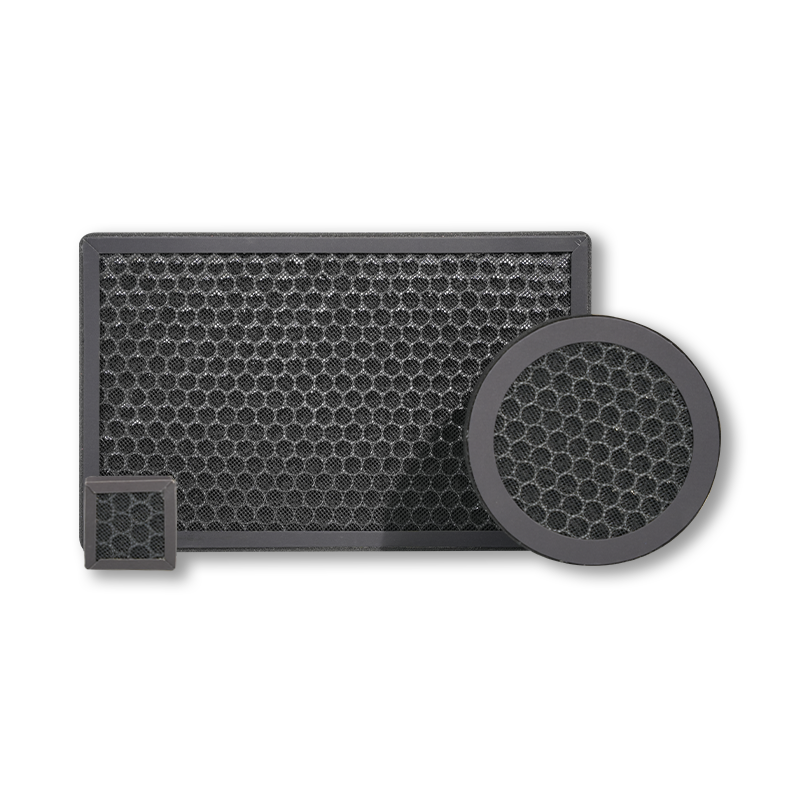
Carbon-Impregnated Reticulated Foam
An open-cell polyurethane or polyester foam is dipped into a slurry of powdered activated carbon (PAC) with a polymer binder, squeezed, and cured. The carbon particles — usually 20 to 75 micrometers in diameter — end up bonded to the foam's strut network. Carbon loading in commercial products runs from 10% to 40% by dry weight. The advantage is kinetic: powdered carbon has a very short internal diffusion path, so adsorption equilibrium is reached in seconds rather than minutes.
Sponge Pouches Filled With Granular Carbon
Here a sleeve or cage of open-cell foam encloses loose granular activated carbon (GAC) of 0.6 to 2.4 mm particle size (commonly 8×30 or 12×40 US mesh). The foam performs mechanical pre-filtration and keeps fines out of the water; the granules do the adsorbing. GAC holds more total capacity per unit volume but needs longer contact time because a molecule may have to diffuse 300 micrometers or more into the granule's center.
The Foam Skeleton
Reticulated foam is specified in PPI (pores per inch), typically 10 to 45. A 10 PPI foam has openings near 2 mm and traps only coarse debris; a 45 PPI foam approaches 200 micrometers and captures fine detritus but clogs quickly. Most combination media use 20 to 30 PPI as a compromise between dirt-holding capacity and flow resistance. The foam contributes roughly 0.02 to 0.05 m² of surface per cm³ — negligible next to the carbon's 1,000 m²/g, but highly relevant for biofilm growth, discussed later.
Where the Surface Area Comes From: Activation
Raw carbon sources — coconut shell, bituminous coal, lignite, wood, bamboo — have almost no usable internal surface. Activation creates it by burning selective channels into the carbon skeleton.
Steam (Physical) Activation
The char is heated to 800–1,000 °C in superheated steam. The water-gas reaction (C + H₂O → CO + H₂) gasifies the most reactive carbon atoms, hollowing out a labyrinth of pores. Burn-off of 40–60% of the original mass is typical; higher burn-off means more surface but a weaker, dustier granule. Coconut-shell carbon activated this way is dominated by very small pores and is the standard choice for taste-and-odor work.
Chemical Activation
Wood or sawdust is impregnated with phosphoric acid or zinc chloride and carbonized at 450–700 °C. The result is a carbon rich in larger pores, better suited to big molecules such as humic acids, tannins and dyes that cannot physically enter a narrow micropore.
Reading the Specification Sheet
|
Standard laboratory indices used to grade activated carbon and what each one predicts in service. |
|||
|
Index |
Typical Range |
What It Measures |
Practical Meaning |
|
Iodine number |
500–1,250 mg/g |
Micropore volume (<2 nm) |
Capacity for small molecules: chlorine byproducts, solvents, odor compounds |
|
BET surface area |
600–1,600 m²/g |
Total accessible surface |
Headline capacity figure; correlates loosely with iodine number |
|
Molasses number |
100–500 |
Mesopore and macropore volume |
Ability to decolorize tannins, humics, dyes |
|
Methylene blue number |
150–300 mg/g |
Mid-size pore access |
Predicts dye and medium-organic removal |
|
Hardness / abrasion number |
90–99 |
Mechanical durability |
Resistance to fines generation during backwash or handling |
|
Apparent density |
0.40–0.55 g/cm³ |
Packing weight |
Converts volumetric bed size into mass of carbon |
For sponge media aimed at odor control, an iodine number above 1,000 mg/g is the single most useful purchasing criterion, because odor compounds are small and need micropores.
Pore Architecture: The Three-Tier Highway System
IUPAC classifies pores by width, and each class plays a completely different role. Understanding the division explains why one carbon removes chlorine taste beautifully but leaves water yellow, while another decolorizes well but barely touches musty odors.
|
Pore size classes in activated carbon and the function each performs during adsorption. |
|||
|
Pore Class |
Width |
Share of Surface Area |
Function |
|
Macropore |
> 50 nm |
< 1% |
Entrance corridors; carry water from the granule surface inward |
|
Mesopore |
2–50 nm |
5–15% |
Distribution branches; also the only sites large organics can occupy |
|
Micropore |
< 2 nm |
85–95% |
Actual storage volume for small molecules |
The Pore-Filling Effect
Inside a micropore, opposing walls are so close that their attractive fields overlap. A molecule sitting there feels attraction from both sides at once, so the binding energy can be two to three times higher than on a flat carbon surface. This is why adsorption is strongest when the pore diameter is roughly 1.3 to 1.8 times the molecule's kinetic diameter. A pore much larger wastes energy; a pore smaller than the molecule excludes it entirely — a genuine size-exclusion effect.
Concrete example: geosmin, the compound responsible for earthy-musty taste in reservoir water, has a molecular size near 0.8 nm. It is adsorbed superbly by coconut carbon whose pore distribution peaks around 1.0–1.5 nm. Humic acid, by contrast, is a sprawling macromolecule of 1,000 to 100,000 daltons that cannot physically enter those pores; removing it requires the wider mesopore structure of wood-based chemical-activated carbon.
The Adsorption Mechanism in Detail
Why Molecules Leave the Water at All
Water is a strongly hydrogen-bonded, highly polar liquid. A non-polar or weakly polar organic molecule dissolved in it disrupts that hydrogen-bond network and is thermodynamically uncomfortable. The carbon surface, made of stacked graphene-like sheets, is non-polar and hydrophobic. When the organic molecule transfers from water to carbon, water molecules recover their hydrogen bonds and the system's free energy drops. The driving force is therefore as much water pushing the molecule out as carbon pulling it in — this is called the hydrophobic effect, and it explains a reliable rule of thumb: the less soluble a compound is in water, the better activated carbon adsorbs it.
The Forces Involved
- London dispersion forces— the dominant mechanism, accounting for most of the binding energy of typical organics, in the range of 10–40 kJ/mol.
- π–π interactions— aromatic rings (benzene, toluene, phenol, many pesticides and odor compounds) stack against the graphene planes and bind noticeably more strongly than straight-chain molecules of similar weight.
- Hydrogen bonding and electrostatic attraction— act at surface oxygen groups (carboxyl, phenolic, lactone) created during activation; these matter for polar and ionizable compounds.
- Chemisorption— true chemical bond formation, relevant mainly to chlorine and chloramine reduction rather than to organic capture.
Describing Capacity Mathematically
Adsorption equilibrium is normally fitted to the Freundlich isotherm, q = KF · C1/n, where q is milligrams adsorbed per gram of carbon, C is the equilibrium concentration remaining in water, KF is a capacity constant and 1/n an intensity constant. A small 1/n value (0.1–0.3) signals strong adsorption that persists even at trace concentrations — exactly the behavior wanted for odor compounds present at nanogram levels. Representative values for coconut-shell GAC at 20 °C:
|
Indicative Freundlich parameters and equilibrium loading for common waterborne contaminants on coconut-shell activated carbon. |
|||
|
Compound |
Water Solubility |
1/n |
Approx. Loading (mg/g) |
|
Trichloroethylene |
1,100 mg/L |
0.48 |
25–30 |
|
Phenol |
83,000 mg/L |
0.54 |
100–160 |
|
Chloroform |
8,000 mg/L |
0.67 |
2–7 |
|
Geosmin |
150 mg/L |
0.25 |
Trace level, very strong affinity |
|
Atrazine |
33 mg/L |
0.29 |
40–90 |
The pattern is unmistakable: solubility and adsorbability move in opposite directions. Chloroform, very soluble and very small, is one of the harder trihalomethanes to hold; trichloroethylene and atrazine, far less soluble, load much more heavily onto the same carbon.
How Odors Specifically Are Eliminated
Odor is the application where activated carbon performs most dramatically, because the human nose and palate detect odor compounds at concentrations far below any health threshold, and because those compounds happen to be exactly the right size for micropores.
Earthy and Musty Notes
Geosmin and 2-methylisoborneol (2-MIB), released by cyanobacteria and actinomycetes, are detectable by sensitive tasters at 4 to 10 nanograms per liter — parts per trillion. Because their Freundlich 1/n values are low, carbon continues to strip them even at those vanishing concentrations. Well-designed carbon contact achieves 90–99% removal of both compounds, which is why a pond or aquarium that smelled swampy becomes neutral within a day of carbon being introduced.
Chlorine and the "Swimming Pool" Smell
Free chlorine removal is not adsorption at all — it is a surface redox reaction in which the carbon acts as a reducing agent and is slowly consumed:
- C* + HOCl → C*O + H⁺ + Cl⁻ (the carbon surface is oxidized, chlorine becomes harmless chloride)
- C*O + 2HOCl → C* + 2H⁺ + 2Cl⁻ + O₂ (regeneration-like step at higher loading)
The reaction is fast. An empty-bed contact time of 30 seconds to 2 minutes typically reduces 2 mg/L free chlorine to below 0.05 mg/L. Aquarists exploit this when dechlorinating tap water, and it is the reason carbon is placed in nearly every drinking-water pitcher and undersink cartridge.
Chloramine
Monochloramine reacts by a similar but far slower pathway. Practical guidance is that chloramine requires roughly three to four times the contact time of free chlorine, which is why catalytic carbons — steam-activated at high temperature to boost surface electron density — are specified when chloramine is the disinfectant.
Sulfur, Fishy and Decay Odors
Hydrogen sulfide (rotten egg), organic amines and mercaptans from decomposing organic matter are all adsorbed, though H₂S is best handled by carbon impregnated with an alkaline or metal-oxide catalyst that converts it to elemental sulfur. In aquarium and pond use, the compounds most often responsible for "tank smell" — short-chain fatty acids, indoles, skatoles and amines from protein decay — are strongly hydrophobic and adsorb readily.
Yellowing and Tannins
Driftwood tannins, leaf leachate and humic substances give water a tea-colored tint. These are mesopore-dependent. Choose a carbon with a molasses number above 300 if color removal is the goal; a high-iodine coconut carbon will clear odor but leave much of the color behind.
Contaminants Captured, With Expected Performance
|
Typical removal performance of activated carbon sponge media across common water quality parameters under adequate contact time. |
|||
|
Parameter |
Removal Mechanism |
Typical Reduction |
Notes |
|
Free chlorine |
Catalytic reduction |
95–99% |
Fast; works at short contact times |
|
Chloramine |
Catalytic reduction |
50–95% |
Needs 3–4× the contact time |
|
Geosmin / 2-MIB |
Micropore adsorption |
90–99% |
Removed to below taste threshold |
|
Trihalomethanes |
Micropore adsorption |
60–95% |
Chloroform hardest of the group |
|
VOCs (benzene, TCE, toluene) |
Adsorption + π-stacking |
90–99% |
Aromatics adsorb especially well |
|
Pesticides / herbicides |
Adsorption |
85–99% |
Atrazine, simazine, lindane all strongly held |
|
Pharmaceutical residues |
Adsorption |
50–95% |
Depends heavily on charge and polarity |
|
Tannins / color |
Mesopore adsorption |
40–90% |
Requires high molasses number carbon |
|
Suspended solids |
Sponge depth filtration |
Down to 20–200 µm |
Determined by foam PPI rating |
|
Ammonia / nitrite |
Biological nitrification on media |
Variable |
Performed by biofilm, not by the carbon itself |
Variables That Control Real-World Performance
Contact Time Above All
Empty bed contact time (EBCT) is the bed volume divided by the volumetric flow rate. EBCT (minutes) = bed volume (L) ÷ flow rate (L/min). A 0.5 L carbon sponge cartridge running at 2 L/min delivers a 15-second EBCT — adequate for chlorine, marginal for trace organics. The same cartridge at 0.25 L/min gives 2 minutes, at which point organic removal improves substantially. Design targets:
- Chlorine and taste polishing: 20 seconds to 2 minutes
- Organic micropollutant removal: 5 to 15 minutes
- Chloramine reduction: 3 to 6 minutes minimum
Recirculating systems such as aquariums and ponds compensate for short single-pass EBCT through repeated exposure. A 200 L aquarium with a 1,000 L/h pump turns the whole volume over five times per hour, so even a 3-second single-pass contact accumulates to meaningful treatment across a day.
Particle Size and Diffusion Distance
Intraparticle diffusion time scales roughly with the square of particle radius. Cutting particle diameter from 2 mm to 0.5 mm shortens the diffusion path fourfold and the equilibration time by about sixteenfold. This is the entire performance argument for carbon-impregnated foam over loose granules: powdered carbon at 40 µm reaches equilibrium in seconds, so it delivers far more of its theoretical capacity in a short-contact, high-flow application.
Concentration Gradient
Adsorption rate is proportional to the difference between the bulk concentration and the concentration in equilibrium with the loaded surface. Fresh carbon in heavily contaminated water works fast; as loading rises, the gradient narrows and the rate falls. This produces the familiar S-shaped breakthrough curve: a long period of near-complete removal, then a fairly rapid rise in outlet concentration as the mass transfer zone reaches the end of the bed.
Temperature
Physical adsorption is exothermic, so equilibrium capacity is slightly higher in cold water, while diffusion is faster in warm water. Across the 10–30 °C range found in household and aquarium use the net effect is modest — generally within 10–15% either way — and is rarely worth designing around.
PH and Ionic Strength
For ionizable compounds, the neutral (protonated or unprotonated) form adsorbs far better than the charged form. Weak organic acids such as phenols therefore adsorb best below their pKa, typically at pH 6–7 rather than pH 9. Higher ionic strength generally improves adsorption of neutral organics by reducing their solubility — the salting-out effect — which is one reason carbon often performs well in marine aquaria.
Competitive Adsorption
Real water contains a mixture. Background natural organic matter occupies pores and reduces capacity for the target compound, and strongly adsorbed molecules can displace weakly adsorbed ones already on the surface. In practice this means a carbon rated at 20% loading in a single-solute laboratory test may deliver 5–8% in real water, and it is the main reason manufacturer capacity claims should be read as ceilings rather than expectations.
|
Operating variables and the direction in which each influences adsorption performance. |
||
|
Variable |
Change |
Effect on Removal |
|
Contact time |
Longer |
Strongly improved |
|
Carbon particle size |
Smaller |
Faster kinetics, higher utilization |
|
Iodine number |
Higher |
More capacity for small molecules |
|
Molasses number |
Higher |
Better color and large-molecule removal |
|
Solute solubility |
Lower |
Adsorbs more strongly |
|
Water temperature |
Lower |
Slightly higher equilibrium capacity |
|
pH (for weak acids) |
Below pKa |
Improved adsorption of neutral form |
The Sponge's Own Contribution
Depth Filtration
Open-cell foam is a depth filter, not a surface screen. Particles are captured throughout the thickness by interception, inertial impaction and sedimentation, which gives it a dirt-holding capacity many times that of a flat screen of the same rating. A 30 PPI foam 25 mm thick typically holds 200–400 g of solids per square meter before differential pressure doubles. Layering matters: place a coarse 10 PPI layer on the inlet side and a fine 30–45 PPI layer downstream to build a graded-density filter that resists premature blinding.
Protecting the Carbon
Suspended solids that reach carbon coat the granule exterior and block macropore entrances, cutting off access to the interior. A sponge pre-layer keeps the carbon's mouth open and is one of the cheapest ways to extend service life — in practice, adding effective mechanical pre-filtration commonly extends carbon life by 30–50%.
Sizing, Service Life and Worked Examples
Example 1 — Dechlorinating Household Water
Tap water at 2 mg/L free chlorine, 8 L per day, cartridge containing 150 g of carbon. Chlorine reduction consumes roughly 1 g of carbon per gram of chlorine destroyed under typical conditions. Daily chlorine load = 8 L × 2 mg/L = 16 mg. On chlorine chemistry alone the carbon would last years; in reality organic fouling and pore blockage, not chlorine, dictate a 2–3 month replacement interval. This is the general rule for drinking-water carbon: the practical limit is organic loading, not the headline contaminant.
Example 2 — Aquarium Odor and Discoloration Control
A 200 L freshwater aquarium with moderate stocking produces on the order of 5–15 mg/L of dissolved organic carbon accumulation per month if unmanaged. Standard dosing guidance is 50–100 g of carbon per 100 L of water, replaced every three to four weeks. Two observable signals confirm exhaustion: yellow tint returning to the water when viewed lengthwise against white, and the reappearance of a noticeable smell when the lid is opened.
Example 3 — Koi Pond Polishing Loop
A 10,000 L pond is not carbon-treated in full flow — that would be prohibitive. Instead a side-stream loop treats perhaps 10% of circulation through 5 kg of carbon in sponge cassettes, which is sufficient to keep geosmin and dissolved organics below perceptible levels while keeping pressure drop and cost manageable.
Quick Sizing Reference
|
Common applications with indicative carbon quantity, contact time and replacement interval. |
|||
|
Application |
Carbon Quantity |
Target Contact Time |
Replacement |
|
Freshwater aquarium |
50–100 g per 100 L |
Recirculating, 3–5 turnovers/h |
3–4 weeks |
|
Marine aquarium |
25–50 g per 100 L |
Slow passive or reactor flow |
2–4 weeks |
|
Drinking water pitcher |
80–150 g |
30–90 seconds gravity flow |
150–300 L or 2 months |
|
Undersink cartridge |
300–700 g |
10–30 seconds |
2,000–5,000 L or 6–12 months |
|
Ornamental pond |
0.3–0.5 kg per 1,000 L |
Side-stream loop |
4–8 weeks seasonally |
Getting the Most From the Media in Practice
Rinse Before Installing
Manufacturing and shipping generate carbon fines. Rinse new media under running water until the runoff is clear — usually 30 to 60 seconds — to prevent a black haze in the treated water and to avoid fines lodging in downstream pumps or impellers.
Place It Last in the Flow Path
Sequence the filter train as coarse mechanical → fine mechanical → biological → carbon. Carbon in the final position sees the cleanest water, so its pores stay open and it delivers the maximum share of its rated capacity.
Maximize Flow Distribution
Water follows the path of least resistance. If part of the bed is bypassed or channeled, that carbon is never used. Pack media evenly, avoid voids, and prefer a thin, wide bed over a narrow, deep one when pressure drop is a constraint. A well-distributed bed can easily double effective utilization compared to a channeling one.
Clean the Sponge Without Destroying the Biofilm
- Squeeze the foam in a bucket of removed tank or system water, never in chlorinated tap water, so nitrifying bacteria survive.
- Clean mechanical layers every 1–2 weeks; clean biological layers only when flow is visibly reduced.
- If replacing media, stagger the change so that only half is swapped at a time and the bacterial population persists.
Recognize Exhaustion
- Odor returns, most noticeably when the system is first opened or the tap first run.
- Yellow or amber tint becomes visible when a column of water is compared against a white background.
- A chlorine test kit shows measurable free chlorine downstream where it previously read zero.
- Rated throughput volume or the calendar interval has been reached, whichever comes first.
Because breakthrough is gradual, replacing on a calendar schedule is more reliable than waiting for a sensory signal — by the time an odor is detectable, breakthrough has been underway for some time.
Match the Carbon to the Problem
- Odor, chlorine and taste— coconut shell, iodine number above 1,000 mg/g.
- Color, tannins and humics— wood or lignite based, molasses number above 300.
- Chloramine— catalytic carbon, with extended contact time designed in.
- Mixed municipal water— blended or bituminous-coal carbon, which spans both pore ranges.
- Reef aquaria— low-phosphate, low-ash acid-washed carbon to avoid leaching phosphate into the system.
Key Takeaways
- Adsorption is a surface phenomenon driven by the hydrophobic effect and van der Waals attraction, concentrated inside micropores that supply 85–95% of the carbon's 800–1,500 m²/g of surface.
- Pore size must match molecular size; iodine number predicts odor performance, molasses number predicts color performance.
- Chlorine is destroyed by catalytic reduction rather than adsorbed, which is why it is removed so quickly and at such short contact times.
- Contact time is the dominant design variable; small particles in impregnated foam compensate for short EBCT by reaching equilibrium far faster than granules.
- The sponge carrier adds depth filtration to 20–200 µm, shields the carbon from blinding, and hosts the nitrifying biofilm that handles ammonia the carbon cannot.
- Place carbon last in the flow train, rinse it before use, distribute flow evenly, and replace on schedule rather than on symptoms.